•The Node System Monitor helps you with debugging your Node System
•Monitor and observe incoming and outgoing data of a selection of Nodes
•Get informed about wrong incoming data and/or errors
User Interface
There are 2 ways to open a Node System Monitor
1. Open as an extra editor window
As for all other editors and windows:
•Go to the "Windows" tab at Main Menu on top
•Open a new "Node System Monitor" window
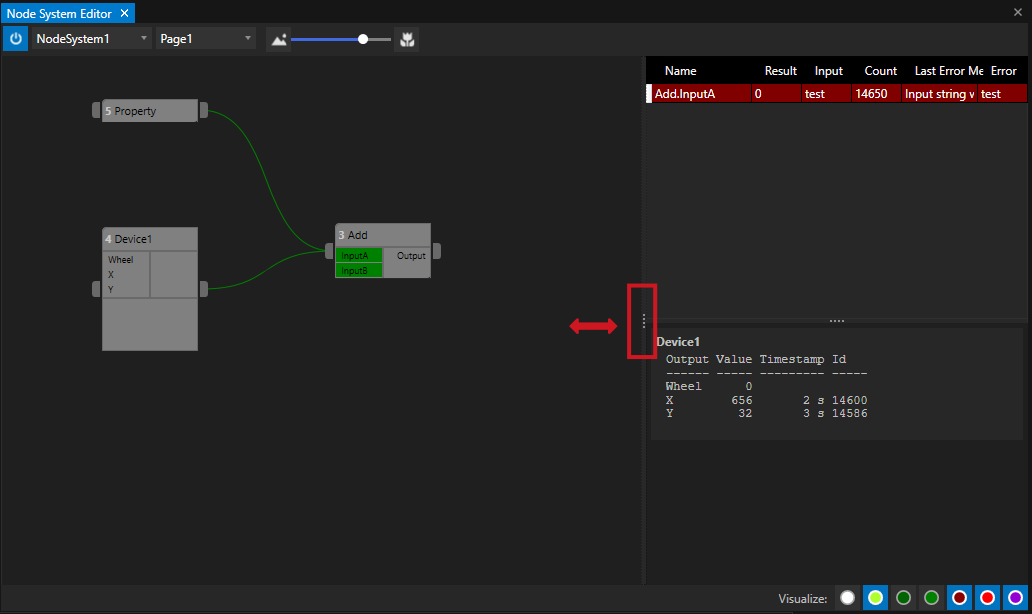
2. Quick Access - move out of Node System Editor
If you work with the Node Systems Editor and want to have just a quick access to the Node System Monitor:
•Move your mouse to the 4 dots on the right side of the Node System Editor window
•Drag to the left with pressed mouse button
•The Node System Monitor window opens as a "split screen"
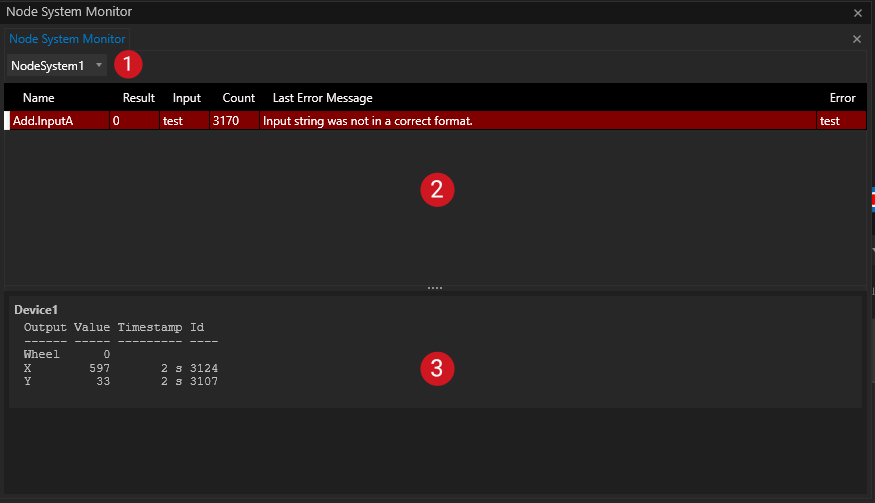
Window Layout
|
Select Node System |
Select one of your Node Systems which you want to monitor |
|
Error Log |
Displays all data errors that occur during your Node System is running. |
|
Node Monitoring |
Displays the outputs of preselected Nodes. |


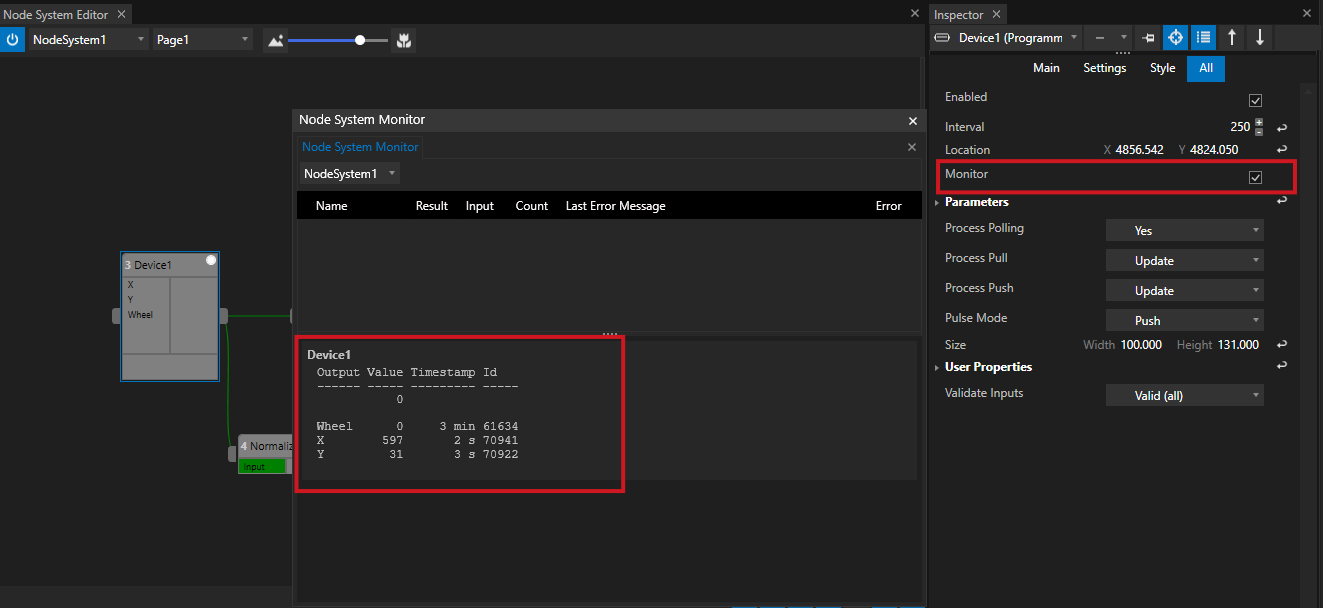
Add a Node to the Node System Monitor
•Select a Node into the Inspector
•Search for the "Monitor" Property
•Enable the Monitor flag in the Inspector
All Nodes with enabled "Monitor" flag are listed with its output information into the Node System Monitor
Interpret Errors
The Error log of the Node System Monitor should help you to interpret and collect errors that are thrown while your Node System is "running" and calculates data.
There are 3 types of entries possible:
1.No entry: There is currently no error and no errors have occurred since the Node System was started.
2.A red entry: There is currently an error. There are incorrect values at a Node input.
3.A green entry: An error has occurred in the past and an incorrect value has been applied to an input. This value is now correct again. The error is nevertheless recorded.
 The\" Add Node\" expects two decimal numbers as an input. The Mouse Device Node gives an decimal x coordinate as an Input B. Input A of the Add-Node is connected to an Output of the Pass-Through Node. The value of its output is a text - not a decimal number. An error is thrown.: The Input is not in the expected range.")
The example of the screenshot shows a Node for a Mouse Device that is connected to aPass Through Node with two Parameters added: The values of the Parameters are passed through from input to output (In ihis example case the pass through device is only used to generate some values and connect them to the input of the "Add Node")
The" Add Node" expects two decimal numbers as an input. The Mouse Device Node gives an decimal x coordinate as an Input B. Input A of the Add-Node is connected to an Output of the Pass-Through Node. The value of its output is a text - not a decimal number. An error is thrown.: The Input is not in the expected range.
 was changed from a text \"test\" to a decimal number \"100\". Now the expected value range applies on the Input of the \"Add\" Node. The calculation of the \"Add\" Node can be processed. In the Node System Monitor the line with the logged Error changes to a green color. The old wrong text value \"test\" still is listed above the correct new value \"100\"")
Pass-Through Node: The value from the Input 1 Parameter ) was changed from a text "test" to a decimal number "100".
Now the expected value range applies on the Input of the "Add" Node. The calculation of the "Add" Node can be processed.
In the Node System Monitor the line with the logged Error changes to a green color. The old wrong text value "test" still is listed above the correct new value "100"
 Errors are "expensive" for real-time node systems
Node systems that calculate and process data directly ("real-time") are built to calculate large amounts of data - over and over again. Errors are usually very "expensive" - they block resources that are needed to calculate other data. They should not be undetected and therefore they even remain as "green colored" entries in the Node System Monitor until the Node System is stopped and restarted. Sometimes it is helpful to observe such cases, especially when the error has "become obsolete" because valid values have arrived in the meantime.