•The Node System Editor helps you to create, arrange, control and order your Nodes
•With different monitoring tools you are able to get an overview about the data flow or the state
•Snapping tools, rulers but also layout controls like labels or tile boxes help you to keep the overview into your Node System
User Interface
Create an new Node System first:
•Go to the Main Menu on top, select "Create" there and "Node System"
or
•Go to the "Node System" category into Project Explorer, open the context menu by a right-click and create a new Node System
Open a Node System Editor:
•Go to Main Menu > Windows
•Open a new Node System Editor

|
Enable/Disable Node System |
Default: Enabled |
|
Select a Node System |
Select a Node System or a Composite Node to show this into Editor |
|
Select a Page |
Select a Page of your Node System |
|
Zoom in/out |
Zooms working area in and out |
|
Working Area |
Main working area to create and wire your Nodes |
|
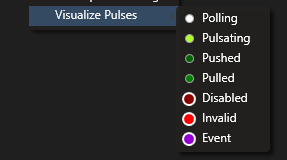
Visualize Pulses |
Different options to monitor the data flow and the data pulses of your Node System: Blinking Dots are displayed into every Node. They visualizes if/when data is pulled, pushed, if nodes are disabled or actions are triggered. |


Context Menu
With a right-click into an empty space of the working area, you open the context menu.
This menu gives you access to the most common actions like:
•Add a Node
•Add Controls as visual helpers for your node layout or labels
•Add and Inspect Pages
•Do zoom settings
•Select one of your nodes from a list
•Do settings for the Node System Editor, the editors behaviour or for monitoring data

 Context Menu for Nodes
If you right-click on a Node, an extended context menu opens.
This contains additional options for the Node, but also the settings for the Node System Editor.
Create and Connect Nodes
Node Systems are deeply integrated into VERTEX.
The workflow of the Node Systems Editor corresponds to the one you already know in other places in the software:
•You e.g. can create Nodes by drag and drop items from Project Explorer or from the Playback Editor to the Node System Editor
•The same works for Properties from the Inspector (you might already know this from e.g. the Wiring or Triggering Editor). Just drag a Property from Inspector to the Node System Editor and a contect menu opens to create a Node
There are a lot of other possibilities and options. All you will find summarized in the extra topic Working with Nodes
 Expand/collapse Node(s) with a double click
Double-click with your mouse on a Node to collapse or expand it. Select multiple Nodes, hold the SHIFT-Key and double-click to expand or collapse multiple Nodes.
Editor Settings
There are different options for the Node System Editors layout, the snapping and startup behaviour.
•Right-click into the working area
•open the Context Menu
•select one of the entries and
•set your enabled or disabled flag there.

Data Monitoring
The Node System Editor offers you a Tooltip Monitoring to quickly check:
•Input and Output Data of a Node
•Conditions of a Node
•Pulse types of a Node
Just move your mouse above a Node. The Tooltip Monitoring pops up and shows you the current values and all information.

To specify and customize the information that should be displayed into the tooltips:
There is a entry into your Context Menu where you are able to select the information that should be displayed.

When you move the mouse over the connection lines the connected properties will be displayed as a
tooltip:

Pulse Monitoring
For testing, debugging or just to get an overview our Node System Editor offers you different types or data pulse visualizations for your Nodes.
Data is pushed to Nodes and/or pulled from Nodes with a Pulse. Sometimes it could be helpful to animate this different types of Pulses or the current Node state.
The build-in Pulse visualization helps you to e.g. check
•if/when data is polled
•if or when data is being pushed
•if or when data is being pulled
•if data is invalid
•if the node is disabled
•or when an event - like a script execution is triggered
The pulses are displayed as blinking dots into every Node.

There are two ways to set :
•Visualize menu at the footer/right-bottom of the Node System Editor
•"Visualize Pulses" into the Context Menu (open with a right-click into the Node System Editor)
Both ways always enable the pulse visualization type globally for all Nodes.